The hardest errors in a financial model are often not arithmetic errors. They are connection errors.
A sales-driven revenue stream can be linked to the wrong role. An expense can draw its budget from the wrong funding round. A hiring plan can begin before the cash expected to support it arrives. The projections still calculate, so the problem may not be obvious in a statement or summary metric.
The new Visualizations page gives you two ways to inspect the model behind the totals:
- Dependencies checks how the items in your model are connected.
- Capital Flow shows how funding, revenue, spending, and cash change over time.
Inspect how the model is wired
Dependencies is a graph of the relationships between funding rounds, expenses, costs, team roles, and revenue streams. If you think in software terms, it is close to a dependency graph for your model configuration.
Select an item to isolate its direct connections. For example, you can confirm that a sales-driven revenue stream uses the intended sales roles, or that a funding-based hiring plan points to the correct round. Double-click an item to edit it without leaving the graph.
This view is especially useful after importing a model, adding a budget-based cost, or changing assumptions shared by several scenarios. It lets you check the structure directly instead of inferring it from the resulting numbers.
See whether funding is building a sustainable business
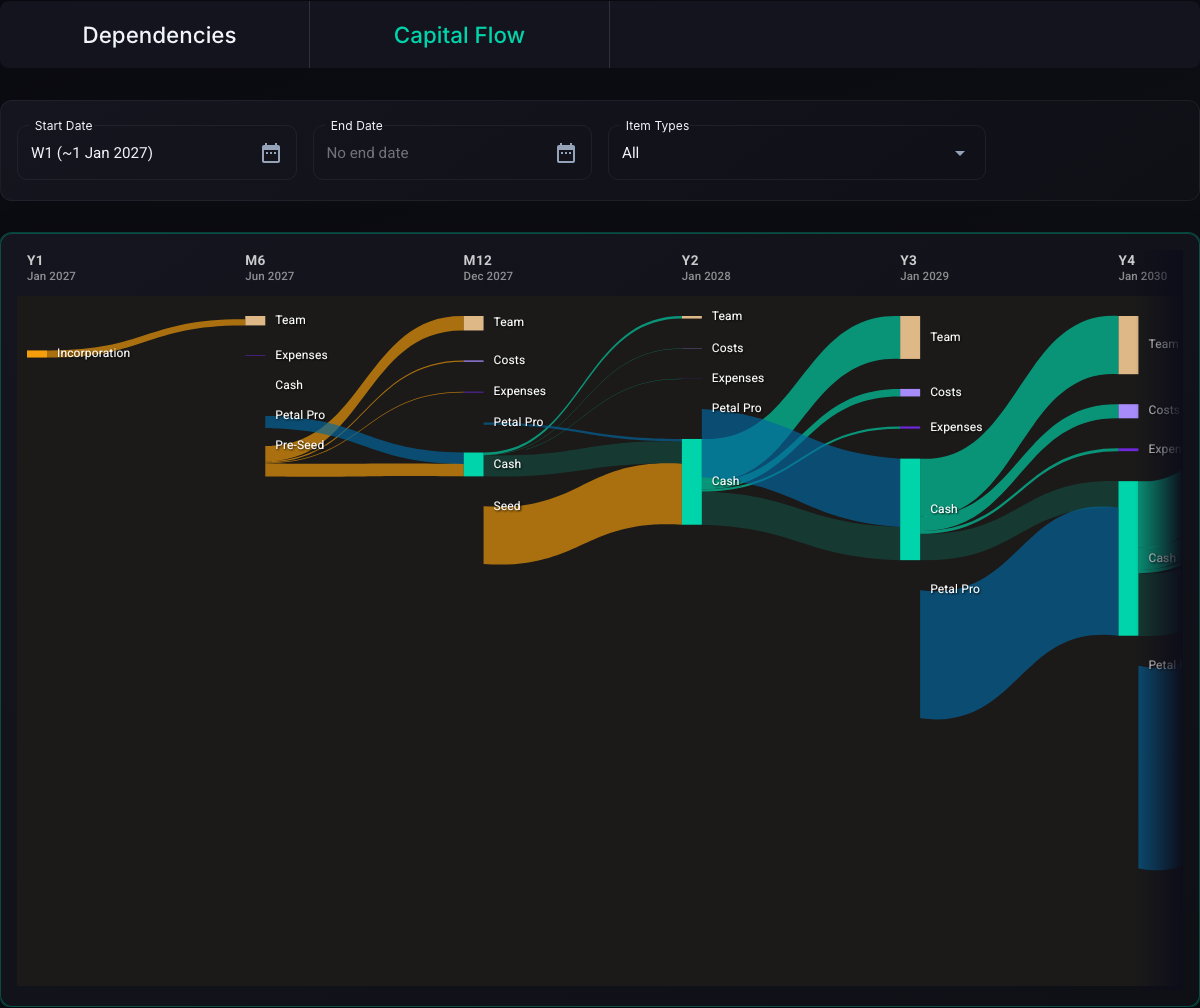
Capital Flow is a Sankey chart, where the width of each band represents the amount of money moving through that part of the model. Cash carries forward between periods, while funding and revenue add to it and team, costs, and expenses consume it.
The chart creates a new slice when something meaningful changes, such as a funding round closing, a revenue stream starting, or a new model year beginning. This makes the phases of the company visible without drawing a separate column for every month.
One of our demo companies, Petal, illustrates why this is useful. Its Incorporation round funds the first phase, followed by a $500,000 Pre-Seed and a $1 million Seed. Revenue from Petal Pro is initially small compared with those rounds. By years three and four, the revenue band is the largest source of new cash.
An ending cash balance cannot show that transition by itself. Two companies can end the year with the same cash balance, while one is increasingly funded by customers and the other is still spending the remainder of its last round. Capital Flow makes the difference visible.
Compare that with Solstice Health, another demo company. Its revenue grows, but never becomes the main source of cash within the model horizon. Most of the ending cash still traces back to investment. The Series A adds cash, but it does not visibly accelerate revenue growth. It extends runway while the business continues to consume more cash than customers provide. That can make the ending balance look reassuring even though the underlying model remains unprofitable and dependent on funding. The model then needs to answer a more important question: what must change for customer revenue to carry the business?
Questions the chart can answer
Use Capital Flow to check questions such as:
- Is cash increasing because revenue is growing, or because a new funding round closed?
- Does team spending expand before the revenue or funding intended to support it?
- How long does each funding round continue to carry the company?
- Is the next round bridging a temporary gap, or financing a cost base that revenue never catches up with?
- Does a scenario change the timing and shape of the business, or only its ending cash balance?
You can narrow the date range when the full model is too dense, or filter the chart to selected item types. For example, show only Funding, Team, and Cash to inspect a hiring plan, then add Revenue to see whether sales eventually support that team.
Use both views as a debugging loop
When a projection looks wrong:
- Open Visualizations > Dependencies.
- Select the relevant item and verify its incoming and outgoing connections.
- Double-click it to correct the assumption if needed.
- Switch to Capital Flow to see how the corrected structure affects cash over time.
- Change the date range or item filters to focus on the affected period.
- Switch scenarios to confirm that each alternative behaves as intended.
Use statements for exact monthly and annual totals. Use Dependencies to check that the model is connected as intended, then use Capital Flow to see whether its financial story makes sense over time.
Availability
Visualizations is available during the trial and on both paid plans.
- Dependencies is fully available during the trial and on either the Core plan or Growth plan.
- Capital Flow is full-horizon on the Growth plan.
- Capital Flow is preview-capped during the trial and on the Core plan, with an in-page upgrade prompt.